Incorporating Descriptive Analytics into Business Practices

Understanding Descriptive Analytics and Its Importance
Descriptive analytics serves as a foundational element in understanding business data. It involves collecting historical data and summarizing it to reveal patterns and trends. Think of it as the first step in a detective story, where the data is the evidence that helps us understand what has happened in the past.
Without data, you're just another person with an opinion.
By analyzing past performance, businesses can gain valuable insights into customer behavior, sales trends, and operational efficiencies. This not only helps identify what worked well but also highlights areas needing improvement. The clearer the picture we have of our past, the better equipped we are to shape our future strategies.
In a world driven by data, descriptive analytics provides the clarity that businesses need to make informed decisions. It acts as a compass, guiding organizations toward areas ripe for growth and innovation. Ultimately, it helps build a robust foundation for more advanced analytics in the future.
Key Components of Descriptive Analytics
Descriptive analytics relies on several key components, including data collection, data cleaning, and data visualization. Data collection refers to the systematic gathering of information from various sources, whether that’s sales records, customer feedback, or social media interactions. Cleaning this data ensures accuracy and reliability, which is crucial for drawing meaningful insights.
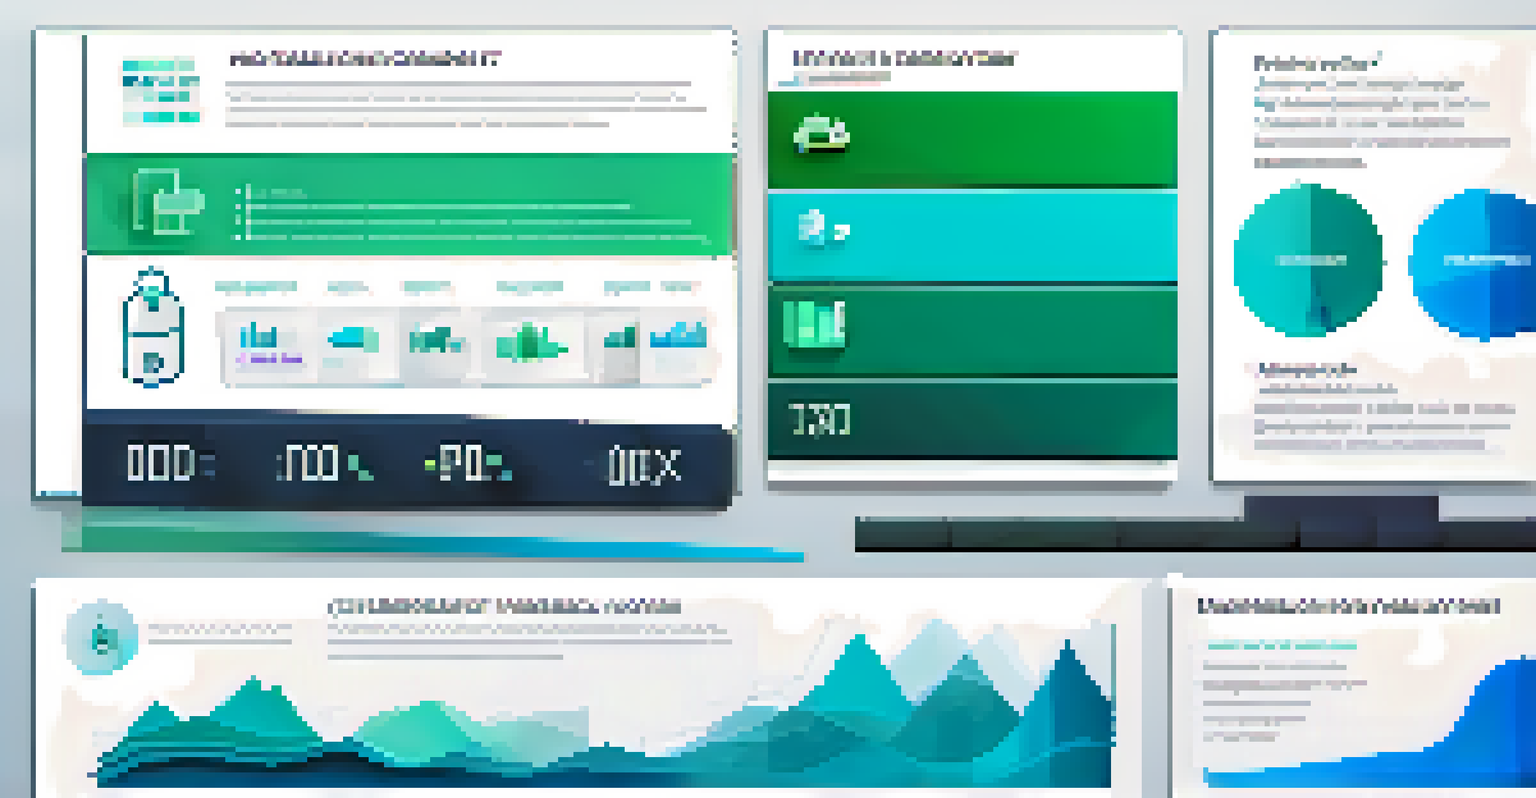
Once the data is clean, data visualization comes into play. This involves creating charts, graphs, and dashboards that make complex data easy to understand at a glance. Imagine trying to read a long list of numbers; it’s much easier to grasp when it’s presented visually, like a pie chart showing market share.
Descriptive Analytics Basics
Descriptive analytics is essential for summarizing historical data, helping businesses understand past performance and guide future strategies.
Together, these components create a cohesive framework for turning raw data into actionable insights. By focusing on these elements, businesses can better understand their performance and enhance their decision-making processes.
Real-World Applications of Descriptive Analytics
Descriptive analytics finds applications across various industries, from retail to healthcare. For instance, retailers often analyze sales data from previous years to identify seasonal trends. This insight helps them optimize inventory levels and promotional strategies, ensuring they meet customer demand without overstocking.
In God we trust; all others bring data.
In healthcare, descriptive analytics can track patient outcomes over time, helping hospitals evaluate the effectiveness of treatments. By summarizing data about patient recovery rates, healthcare providers can make data-driven decisions to improve service quality.
These examples illustrate how descriptive analytics empowers organizations to make informed decisions based on historical data. By leveraging these insights, businesses can enhance operational efficiency and customer satisfaction.
Challenges in Implementing Descriptive Analytics
While incorporating descriptive analytics can be beneficial, businesses often face challenges in implementation. One major hurdle is data integration, as organizations frequently collect data from multiple sources that may not communicate well with each other. This disjointed data can hinder a comprehensive analysis.
Another challenge is ensuring data quality. Inaccurate or outdated data can lead to misguided conclusions, potentially jeopardizing strategic decisions. Companies must invest time and resources into data cleaning and validation to avoid these pitfalls.
Key Components Explained
The process of descriptive analytics involves data collection, cleaning, and visualization to transform raw data into actionable insights.
Lastly, there may be resistance to adopting new analytics tools and techniques among teams accustomed to traditional methods. Overcoming this resistance often requires training and demonstrating the tangible benefits of using descriptive analytics to build confidence in the process.
Tools and Technologies for Descriptive Analytics
Fortunately, there are many tools available to assist businesses in their descriptive analytics journey. Software like Tableau or Microsoft Power BI offers user-friendly interfaces for creating visual reports and dashboards. These tools simplify the process of data visualization, making insights accessible to everyone, not just data scientists.
Additionally, Excel remains a powerful tool for basic descriptive analytics, allowing users to manipulate and visualize data using familiar spreadsheet functionalities. It's a great starting point for businesses just beginning to explore the world of analytics.
Cloud-based solutions, such as Google Analytics, also provide valuable insights into website performance and user behavior, making them essential for online businesses. By leveraging these technologies, companies can streamline their descriptive analytics processes and make data-driven decisions more efficiently.
The Role of Descriptive Analytics in Decision-Making
Descriptive analytics plays a critical role in the decision-making process by providing evidence-based insights. When businesses rely on data rather than intuition, they are more likely to make sound decisions that lead to positive outcomes. This approach minimizes risks associated with guesswork and hasty decisions.
Moreover, descriptive analytics fosters a culture of transparency within organizations. By sharing insights across teams and departments, everyone can align their efforts toward common goals. This collaborative environment encourages innovative solutions to challenges faced by the business.
Future Trends in Analytics
Emerging trends like AI integration and real-time analytics are shaping the future, making data insights more accessible and actionable for businesses.
In essence, descriptive analytics empowers teams to make informed choices and promotes a data-driven mindset. When decisions are backed by solid data, organizations can better navigate the complexities of their operational landscape.
Future Trends in Descriptive Analytics
As technology continues to advance, so too does the field of descriptive analytics. One emerging trend is the integration of artificial intelligence and machine learning to enhance data analysis. These technologies can automate data processing and identify patterns that may not be immediately apparent to human analysts.
Another trend is the increasing focus on real-time analytics. Businesses are recognizing the value of accessing data insights in real-time, allowing for quicker responses to market changes and customer needs. Imagine being able to adjust a marketing campaign on the fly based on immediate feedback; that’s the power of real-time analytics.

Finally, the rise of self-service analytics tools is empowering more individuals within organizations to engage with data. As these tools become more intuitive, even those without a technical background can explore analytics, fostering a broader culture of data literacy. This democratization of data ensures that insights are not confined to a select few but shared across the organization.