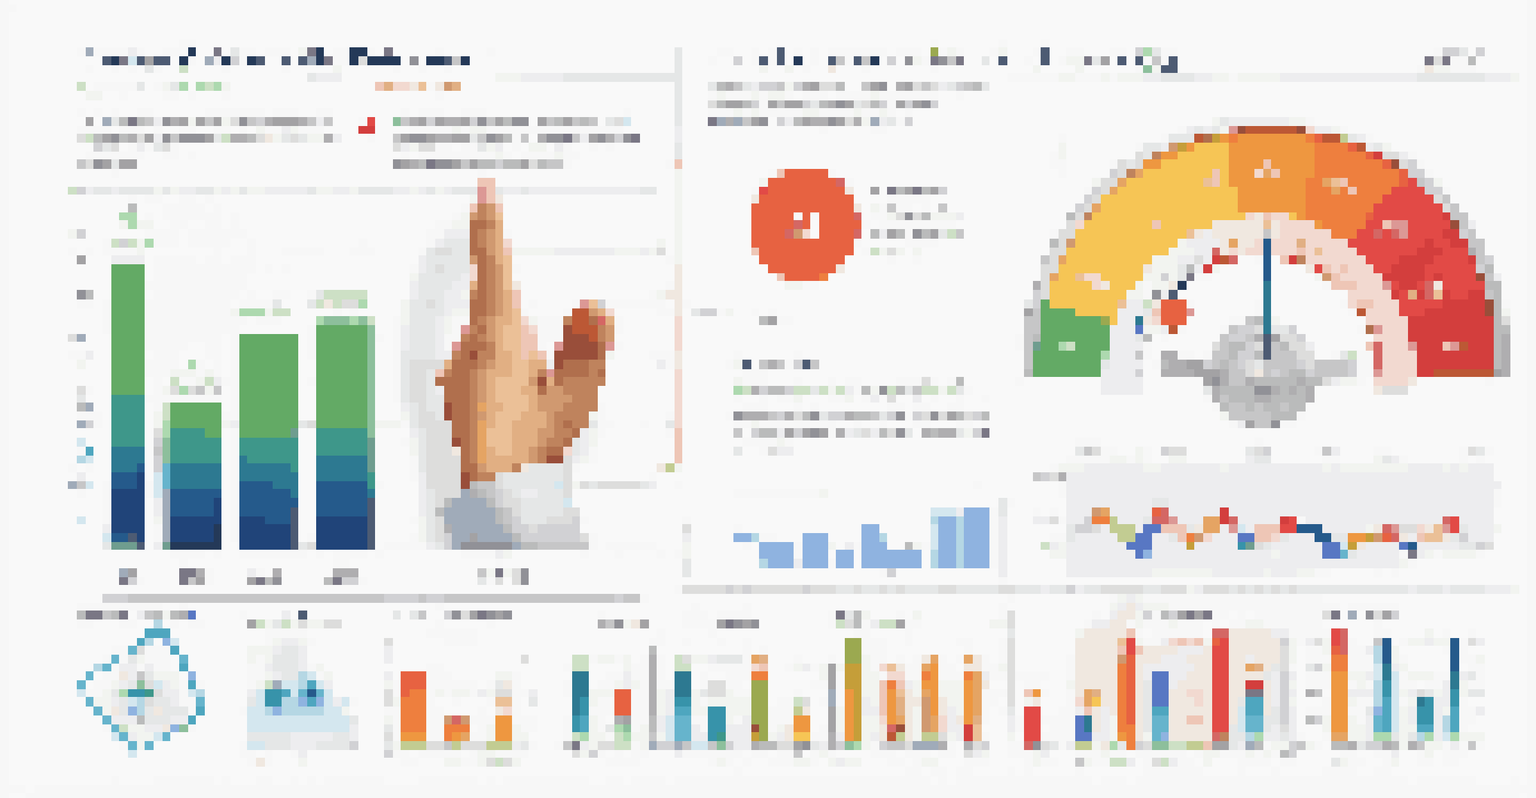
Monitoring Sales Performance: Metrics You Should Track

Understanding Sales Performance Metrics: An Overview
Sales performance metrics are essential tools for any business looking to optimize its sales strategy. These metrics provide insights into how well your sales team is performing and highlight areas for improvement. By tracking the right metrics, you can make informed decisions that drive growth and enhance efficiency.
What gets measured gets managed.
Think of sales metrics as the dashboard of your business vehicle. Just as you wouldn't drive without checking your fuel level and speed, you shouldn't operate your sales strategy without monitoring key metrics. They guide you toward your destination by providing a clear picture of your current performance.
In this article, we'll explore the most critical sales performance metrics you should track. Whether you're a seasoned sales professional or just starting out, understanding these metrics will empower you to make data-driven decisions that lead to success.
Sales Revenue: The Bottom Line Metric
Sales revenue is perhaps the most straightforward yet crucial metric to track. It represents the total amount of money your business brings in from sales over a specific period. Monitoring this metric helps you understand the overall health of your business and whether you're meeting your financial goals.

For example, if your sales revenue is steadily increasing, it indicates that your sales strategies are effective. Conversely, a decline could signal the need for a change in tactics or products. Regularly reviewing your revenue allows you to spot trends and adjust your approach accordingly.
Key Sales Metrics for Success
Understanding and tracking essential sales performance metrics empowers businesses to optimize strategies and drive growth.
In addition, breaking down your sales revenue by product line or region can provide even deeper insights. This granularity helps identify which areas are thriving and which may need additional support or resources.
Conversion Rate: Turning Leads into Customers
The conversion rate is another vital sales performance metric that indicates how effectively your team turns leads into paying customers. It’s calculated by dividing the number of conversions by the total number of leads, then multiplying by 100 to get a percentage. A higher conversion rate suggests that your sales process is effective.
In sales, a referral is the key to the door of resistance.
Imagine you’re fishing—your leads are the fish in the water, and your conversion rate tells you how many you’re actually catching. If you're not reeling in many, it might be time to assess your bait (or in sales terms, your approach) to make it more attractive.
Tracking your conversion rate over time can reveal patterns and help you identify successful strategies. You may find that certain sales tactics work better for specific demographics, allowing you to tailor your approach for optimal results.
Average Deal Size: Understanding Customer Value
Average deal size is a metric that provides insights into the typical revenue generated per sale. This metric is calculated by dividing total sales revenue by the number of deals closed. Understanding your average deal size helps you gauge the value of your customer relationships and can inform pricing strategies.
For instance, if your average deal size is increasing, it may indicate that you’re successfully upselling or cross-selling to your clients. Conversely, a decrease could suggest that you need to reassess your pricing or the value you’re offering.
Customer Acquisition Costs Matter
Monitoring Customer Acquisition Cost (CAC) ensures that marketing expenditures align with the revenue generated from new customers.
This metric also assists in forecasting future sales revenue. By knowing your average deal size, you can more accurately predict how many deals you need to close to meet your revenue targets.
Sales Cycle Length: The Time to Close Deals
Sales cycle length measures the average time it takes to close a deal, from the initial contact to the final sale. This metric is essential for understanding your sales process's efficiency. A shorter sales cycle often indicates a streamlined process, while a longer cycle may highlight areas needing improvement.
Think of the sales cycle as a marathon; the quicker your team can finish, the more deals they can potentially close. If your sales cycle is dragging on, it might be time to analyze the steps involved and identify any bottlenecks.
By tracking this metric, you can also identify seasonal trends and adjust your strategies accordingly. For instance, if you notice that your sales cycle length increases during certain times of the year, you can prepare your team to address this reality.
Customer Acquisition Cost: Knowing Your Investment
Customer Acquisition Cost (CAC) is a critical metric that tells you how much it costs to acquire a new customer. This includes all marketing and sales expenses divided by the number of new customers gained in a specific period. Understanding your CAC helps ensure that your customer acquisition strategies are sustainable.
To put it simply, knowing your CAC is like knowing how much you spend to get a ticket to a concert. If your ticket price is too high compared to the value of the concert, you might rethink your approach. Similarly, if your CAC is higher than the revenue generated from the customer, adjustments are necessary.
Churn Rate Indicates Customer Loyalty
A high churn rate signals potential dissatisfaction and highlights the importance of customer retention strategies for long-term success.
Monitoring this metric can help you optimize your marketing spend and improve your sales strategies. By keeping your CAC in check, you can ensure that your business remains profitable while still attracting new customers.
Churn Rate: Measuring Customer Retention
Churn rate is a vital metric that measures the percentage of customers who stop doing business with you over a specific time frame. A high churn rate can indicate dissatisfaction with your product or service, while a low rate suggests strong customer loyalty. Tracking this metric is crucial for understanding the long-term health of your customer relationships.
Imagine you’re watering a garden; if too many plants are wilting or dying, it’s a signal to assess your care routine. Similarly, if your churn rate is high, it’s time to dig deeper and understand why customers are leaving.
By analyzing your churn rate, you can uncover valuable insights into customer satisfaction and retention strategies. Implementing feedback loops and improving customer support can help reduce churn and foster loyalty.
Sales Growth Rate: Gauging Progress Over Time
Sales growth rate measures the percentage increase in sales over a specific period, helping you gauge your business's growth trajectory. This metric is calculated by taking the difference in sales between two periods, dividing by the sales in the earlier period, and multiplying by 100. Monitoring your sales growth rate is essential for understanding overall business performance.
Think of it as measuring your height each year; it gives you a clear picture of how much you've grown. A positive sales growth rate indicates that your business is thriving, while a negative rate may signal the need for strategic adjustments.
Tracking your sales growth rate over time allows you to set realistic goals and benchmarks. It also helps you understand market trends and how your business stacks up against competitors, enabling you to make data-driven decisions.